

How does reporting on CRM data benefit my business? You love your Zoho CRM, the team are using it (every day), the sales pipeline looks solid and customers seem happy. But do you know with clarity who’s hitting their sales targets or is getting a bit of a free ride? Can you see with ease which product or service is behind your growth in the last couple of months (and do you have enough to keep that going?).
Data, everyone’s got it but are you using yours to your best advantage?
As Zoho CRM experts we are keen on keeping things in the Zoho family, so we regularly recommend Zoho Analytics to take your reporting on CRM data and dashboards to the next level. And for our users on Zoho One or Zoho CRMPlus, it’s included at no extra cost. We do at times get asked ‘what is the best business reporting tool for our business?’ There are many factors that go into choosing your reporting software including ease of implementation, access and cost. We’re going to compare Zoho Analytics and Power BI to help give you an insight into these two powerful reporting tools.
How does reporting on CRM data with a platform like Power BI or Zoho Analytics benefit my business?
Dashboards allow you to collate important data from your business into clear, easy to decipher charts and tables that give you real time insights into how your business is performing. Well designed dashboards include widgets and KPI targets taking the guesswork out of performance and activity. Your business will benefit from improved visibility of business as usual tasks and the ability to track your business goals.
If you’ve got a huge amount of data… we’re talking millions of rows (think 1000’s of customers) then Power BI can be a good option for your business. It can handle processing high volumes of information at speed. Whereas, Zoho Analytics is the best option for small to mid sized businesses to manipulate their data and get basic to mid level complex insights of their businesses.
Can I set up Power BI or Zoho Analytics myself?
Zoho Analytics provides smooth onboarding as it can be accessed on any machine’s browser with only login credentials. It allows users to get familiar with the setup very quickly, with sample reports generated as you connect your data sources.
Power BI requires desktop installation to connect the data, which is easily downloaded from the microsoft website. With a dazzling array of capabilities it can be a bit overwhelming to know where to start, but the help documentation is vast and the community of users is large and helpful.
Let’s recap on why Power BI might be the right data visualisation platform for your business:
Pros:
- Power BI supports more complex data modelling which can be useful for AI and machine learning applications.
- The integration with Microsoft apps is better than any other BI software.
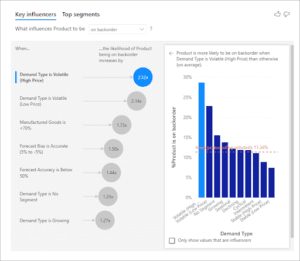
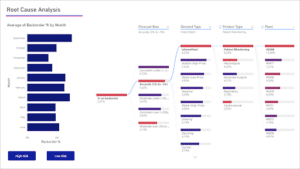
- Power BI offers more detailed reporting options and it supports more attractive visualizations. For example, it provides some of the high end charts which includes “Decomposition Tree” and “Key Influencer Charts”.
- There is an active, well established online community for users to seek support, request features and connect with peers in the business intelligence space.
- It allows users to use Python and R scripting with its desktop version which allows users to format the data in an efficient way.
Cons:
- The integration with third party business applications are limited
- More technical expertise is required to prepare the data – it uses DAX (a programming language) for these operations which can be quite complicated for the new users to learn.
- It can not be connected to Google Sheets.
- Data must be connected or imported in the desktop version (meaning you must first download, install and set up your instance of Power BI), only then your reports can be published via the web tool.
- The desktop version does not support MacOS.
Now we’ll look at what makes Zoho Analytics a good analytics platform:
Pros:
- It’s really easy to get started (just login to your Zoho account) and the interface is easy to learn
- Automatic report creation with the help of AI (Zoho Zia).
- Zoho Analytics offers more than 500 out of the box integrations (native, or with the help of Zapier or Zoho Flow).
- The application is web based and works with all of the operating systems.
- The preparation and visualisation of the data are both done in the cloud application.
- Dashboards can be embedded – this allows a number of reports and dashboards grouped in a single location.
- There are many ‘out of the box’ reports that may meet your business needs
https://www.zoho.com/analytics/auto-data-blending.html
Cons:
- Complex data queries will require some programming skills to implement (SQL)
- Zoho Analytics does not support more complex query functions, such as DAX, Python and R scripting for the manipulation of the data but this would only be an issue if your datasets are huge.
- The configuration of the graphs is limited as it only allows limited number of charts to be connected to the datasource whereas Power BI allows custom visualizations as well. (Power BI Visuals)
- Documentation and training resources available online are relatively basic, so if you’re delving into some complex data sets from some non-standard sources you may not find a huge amount of reference material.
- The online community isn’t as established or engaging as that of Power BI.
Zoho Analytics and PowerBI Pricing Comparison:
What’s included in a Zoho Analytics licence?
- The free version gives access to 2 users and 10K rows of data (this is enough for some basic reports).
- Can be purchased as a standalone application (3 price/ data tiers) or included in Zoho One and Zoho CRMPlus subscriptions.
- Pricing for individual application is based on number of users and volume of data you need.
What’s included in a PowerBI licence?
- Only a free version of PowerBI can be accessed without a Microsoft Office 365 account.
- Licences can be purchased for individual users and start at approximately $14 per month.
- You get unlimited rows up to 10GB of data
- PowerBI Pro is included in Microsoft 365 E5 subscription.
How do I decide which is the right platform for my business?
Zoho Analytics and Power BI are just two of many platforms that can produce complex data visualisations. Depending on the type of business you run, the CRM you currently operate, or your budget you may find one of these options is better suited for your business.
If after reviewing your options you’re still not sure what to go with, give Squirrel a call. We will analyse your requirements and provide you with an agnostic recommendation to help you decide on the best way for reporting on your CRM data.

Squirrel Business Solution’s founder, Kylie Harker, is a Melbourne based consultant who assists business owners find and implement the best fit CRM and other systems for their business. Squirrel focus on four core principles: integrating your systems, streamlining your processes, enhancing your customer experience, and unlocking the value of your data.